Unified District Model
August 2021
In order to score new plans, it is necessary to create a statistical model of the relationship between districts’ latent partisanship and candidates’ incumbency status with election outcomes. This enables us to estimate district-level vote shares for a new map and the corresponding partisan gerrymandering metrics. This page describes the details of our methodology and how we validate the results of this model.
Results for uncontested elections are imputed as described in The Impact of Partisan Gerrymandering on Political Parties and its appendix, by Nicholas Stephanopoulos and Christopher Warshaw.
Methodology
The Big Picture
We use the correlation between the presidential vote on the one hand, and state legislative and congressional votes on the other, to predict how new districts will likely vote and so how biased a plan will be. Our correlations come from the last 10 years of elections, and factor in both any extra advantage incumbents might have as well as how much each state’s results might differ from others. We also allow our predictions to be imperfect by quantifying how much our method missed the actual outcomes of past elections, including the degree to which partisan tides have changed party performance from one election to the next. This enables us to generate the most accurate, data-driven, and transparent prediction we can.
The Details
We use a Bayesian hierarchical model of district-level election returns, run for all state legislatures and congressional delegations on the elections from 2012 through 2020. Formally, the model is:

where
- i indexes district level elections
- s indexes states, with s(i) denoting the state of district election i
- c indexes election cycles, with c(i) denoting the election cycle of district election i
- yi is the Democratic share of the two-party vote in district election i
- Xi is a matrix of covariate values for district election i
- β is a matrix of population-level intercept and slopes corresponding to covariates X
- βs(i) and βc(i) are matrices of coefficients for the state and election cycle, respectively, of district election i
- σy is the residual population-level error term
The model includes two covariates: 1) the two-party district-level Democratic presidential vote share, averaged across 2012 and 2016 and centered around its global mean; 2) the incumbency status in district election i, coded -1 for Republican, 0 for open, and 1 for Democratic. The model allows the slope for each—as well as the corresponding intercept—to vary across both states and election cycles. Chambers accounted for minimal variation in an ANOVA test, so state legislative and congressional results were modeled together as emerging from a common distribution.
When generating predictions, PlanScore draws 1000 samples from the posterior distribution of model parameters, and uses them to calculate means and probabilities. As part of this process we sample from the covariance matrix of cycle random effects, thus allowing the uncertainty of predicting for an unknown election cycle to propagate into our predictions.This has the effect of predicting for an average election over the last 10 years, but with er-ror bands that encompass the full range of partisan tides that actually occurred. Generally speaking, new maps only have either the 2016 or the 2020 presidential elections results, so we must translate those results to the 2012-2020 averages used to estimate the model. For this purpose, we regressed the 2012-2020 averages separately on the 2016 and 2020 results using congressional district data from Daily Kos, and then used the results for the translation. Regression coefficients and intercepts are below.
2020
Pavg = 0.96 ∗ P2020 + 0.01
2016
Pavg = 0.91 ∗ P2016 + 0.05
| Estimate | 95% Credible Interval | |
|---|---|---|
| POPULATION-LEVEL | ||
| Intercept (β0) | 0.50 | [0.47, 0.53] |
| Presidential vote (β1) | 0.83 | [0.68, 0.97] |
| Incumbency (β2) | 0.05 | [0.03, 0.07] |
| STATE-LEVEL | ||
| Standard Deviations | ||
| Intercept (σβ0s) | 0.02 | [0.02, 0.03] |
| Presidential vote (σβ1s) | 0.10 | [0.08, 0.13] |
| Incumbency (σβ2s) | 0.02 | [0.01, 0.02] |
| Correlations | ||
| Intercept - Pres. vote (ρσβ0sσβ1s) | −0.43 | [−0.64, −0.18] |
| Intercept - Incumbency (ρσβ0sσβ2s) | 0.04 | [−0.23, 0.32] |
| Pres. vote - Incumbency (ρσβ1sσβ2s) | −0.69 | [−0.84, −0.49] |
| CYCLE-LEVEL | ||
| Standard Deviations | ||
| Intercept (σβ0c) | 0.03 | [0.01, 0.07] |
| Presidential vote (σβ1c) | 0.15 | [0.07, 0.34] |
| Incumbency (σβ2c) | 0.02 | [0.01, 0.05] |
| Correlations | ||
| Intercept - Pres. vote (ρσβ0cσβ1c) | −0.17 | [−0.80, 0.61] |
| Intercept - Incumbency (ρσβ0cσβ2s) | −0.18 | [−0.81, 0.60] |
| Pres. vote - Incumbency (ρσβ1cσβ2c) | −0.61 | [−0.97, 0.23] |
| Note: Model estimated in brms for R. Model based on 4 MCMC chains run for 4000 iterations each with a 2000 iteration warm-up. All model parameters converged well with R < 1.01. | ||
Predictions
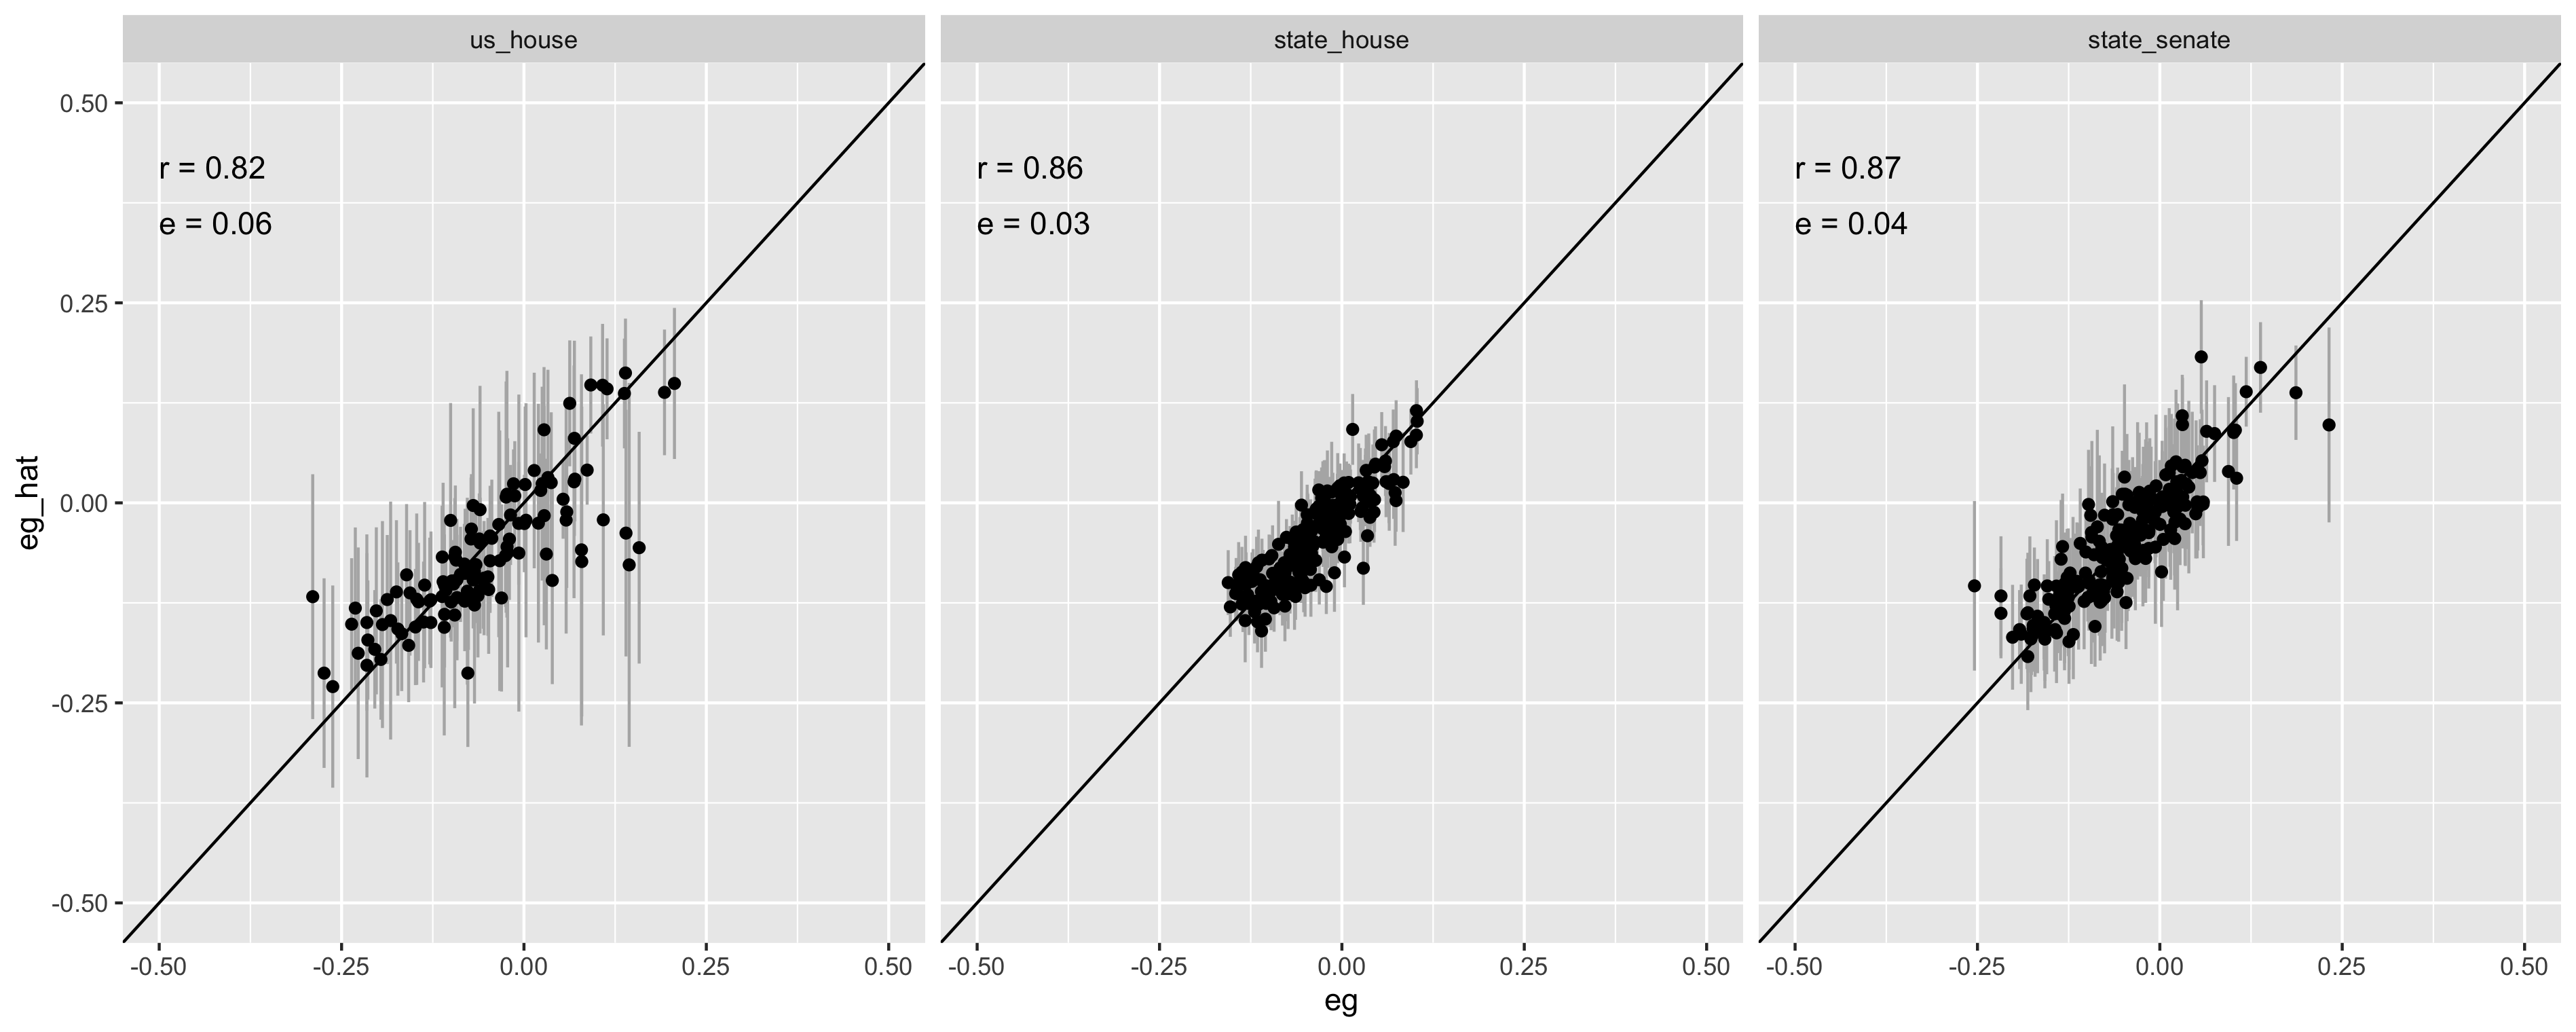
The charts below show comparisons between this model’s in-sample predictions and observed historical scores for plans with at least 7 districts. The results were broadly similar for cross-validated predictions with 10 percent of the sample set aside for testing. The predictions were also quite strong for 2020 in states where we were able to obtain election results for comparison.


Data Sources
Precinct-level presidential vote data used by this model is mostly sourced from the Voting and Election Science Team at University of Florida and Wichita State University.